Python library 1.0.x
Plotting
Functions for easy plotting. Although it is focused on electrochemistry, certain parameters can be changed (like x and y labels) to plot just about anything. It will keep a predetermined format to have consistency between plots.
softpotato.plotting.plot(x, y, xlab='$E$ / V', ylab='$i$ / A', mark='-', legend=False, fig=1, show=False, fileName=False)
Description: plots x and y with a predefined format.
Parameters:
x: list or numpy array
x axis data.y: list or list of list or numpy array
y axis data. If a list of list, each element would correspond to one curve on the plot. The number of the inner elements must correspond to the number of elements of x.xlab: string, optional
Label of the x axis. The default is "E / V" since it assumes a voltammogram. ylab: string, optional
Label of the y axis. The default is "i / A" since it assumes a current.mark: string or list of strings, optional
Marker of the curves. If y is a list of list, mark can accept a list of markers, one for each curve. For accepted markers, visit the matplotlib documentation. By default, each curve will be drawn with a solid line and different color.legend: string or list of strings or False, optional
Legend of the curve, if y is a list of list, legend can accept a list of legends. False by default.fig: int, optional
Figure number, 1 by default.show: boolean, optional
If True, the plot will be shown. False by default.fileName: string or False
If a string, the plot will be save with that string as a file name. False by default.
Examples:
import softpotato as sp
import numpy as np
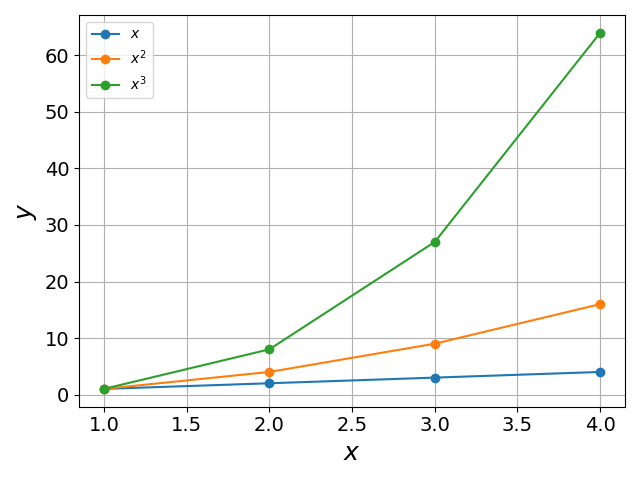
x = np.array([1,2,3,4])
y = [x, x**2, x**3]
legend = ['$x$', '$x^2$', '$x^3$']
sp.plotting.plot(x, y, xlab='$x$', ylab='$y$', mark='-o', legend=legend, show=True)
Description: function to format plots. It is called in softpotato.plotting.plot().
Parameters:
xlab: string
Label of the x axis.ylab: string
Label of the y axis.legend: list of strings or False, optional
List of legends, False by default.show: boolean, optional
If True, the plot will be shown, False by defaultfileName: string or False, optional
If True, it will save the plot with the string given as a file name. False by default.
Examples:
The following code would reproduce the previous figure.
import softpotato as sp
import numpy as np
import matplotlib.pyplot as plt
x = np.array([1,2,3,4])
y = [x, x**2, x**3]
legend = ['$x$', '$x^2$', '$x^3$']
plt.figure(1)
plt.plot(x, y[0], '-o', label=legend[0])
plt.plot(x, y[1], '-o', label=legend[1])
plt.plot(x, y[2], '-o', label=legend[2])
sp.plotting.format(xlab='$x$', ylab='$y$', legend=legend, show=True)